
WordPress server monitoring: CPU, memory, disk and load
WPShift records CPU, memory, disk usage and load for every server it manages and keeps the history. Readings are collected roughly once a minute, over the connection WPShift already has to the server, so there is no agent to install.
Free plan available. Paid plans include a 7-day trial. Server costs are separate.
In the dashboard

Where it sits
The readings come from the server itself.
 WPShift
The dashboard that sets up the server and manages what runs on it.
sets up and manages
Managed in WPShift, outside the server
Plans
Which plans include server monitoring
- Free €0 included
- Solo €5,99 included
- Studio €14,99 included
- Scale €29,99 included
- Server metrics and alerts, from the Free plan
- €0
- Uptime monitoring, a separate feature, from Solo
- €5,99
Per month, excluding VAT. Server costs are separate.
The charts show the last 24 hours by default, with longer history behind them. Server metrics and alerts are included on every plan.
Reading the charts
What the four measurements show
Disk usage that climbs steadily has a date at which it runs out, and you can work that date out from the chart. Memory that does not return to its earlier level after a change is worth investigating.
Disk usage and bandwidth are also recorded per site. CPU and memory are recorded per server.

Comparing
Every server on one chart
Look at one server on its own, or at all of them together to see where capacity is free.

The record
Check a change against what ran
Every operation WPShift runs keeps its steps and output. When the charts change, you can check them against the operations that ran at that time.
Questions
Questions about server monitoring
- Is this the same as uptime monitoring?
- No. Server metrics describe resource use on a server you manage. Uptime monitoring requests a site from outside its server. They are separate checks with separate settings.
- Will this tell me which plugin caused a change?
- Not on its own. The charts show when the server's behaviour changed. The site's plugin and theme list, its logs and the operation record are where to look next.
Related features
-
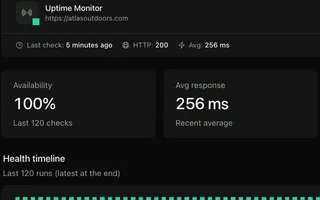 Uptime monitoring From Solo Each monitored site requested from outside its server, with history and an alert on repeated failures.
 -
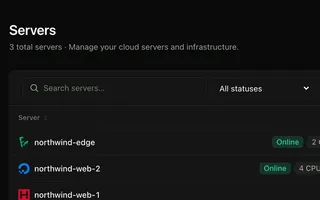 Cloud servers Every plan Connect your cloud account and WPShift installs and configures the server for WordPress.
 -
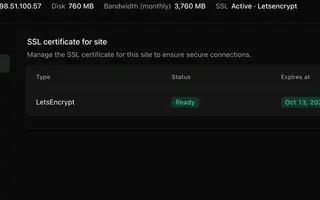 AI Copilot Scale An assistant that answers from your own operation records and waits for approval before it acts.
 -
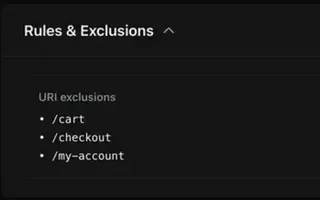 Caching Every plan Page caching in the web server and a Redis object cache, set per site.
Set up your first WordPress server
Connect your cloud account, let WPShift prepare the server, and add a site.
Free plan available. Paid plans include a 7-day trial. Server costs are separate.
The setup, in three steps
- Connect your cloud account
- Choose the region and size
- WPShift sets up the server